Sorry for the admittedly somewhat inane title. I seemed to have misplaced the creative (and serious) part of my mind at this time. Soooooo…I missed some things. But at least I didn’t make any really bad calls. #PositiveAttitude. Ok, now seriously let’s take a look at the EUR and what happened.
EUR
Short-Term

I said back in my last post:
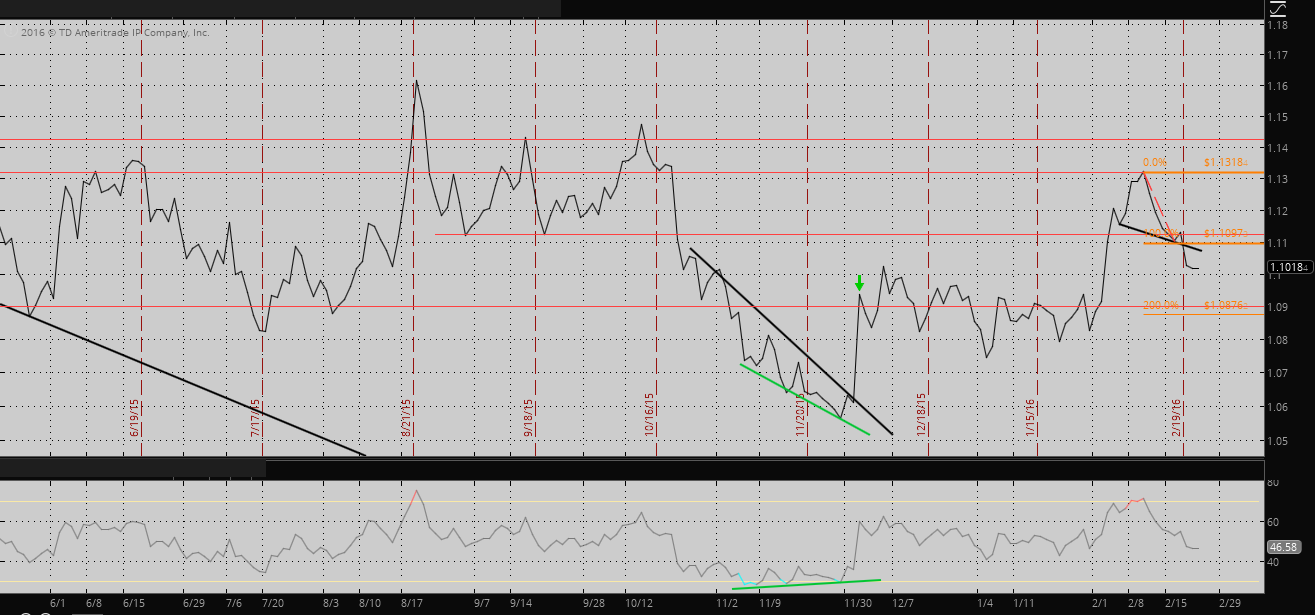
I believe the EUR/USD has completed a small H&S pattern…current target is a 100% (equal decline) of the distance from the top of the pattern (head) to its neckline.
And indeed, we got a bottom almost exactly at this target. A bit past what I said as 1.09 being a more likely target actually. But still pretty close if I do say so myself.
But tell us what’s going to happen now, geez. Ok ok ok.
So as we regained resistance lines, we are getting back to where we were in…early February. While RSI hasn’t exactly confirmed the latest upwards blip, what’s interesting is the room it now has to move higher even if we rally to 1.132. As such it’s possible this level will be gained in the near future. However it’s currently the middle of the week and so it’s kind of a terrible bad time to be making any sort of concrete target…but hey we can move on to the mid-term now.
Mid-Term
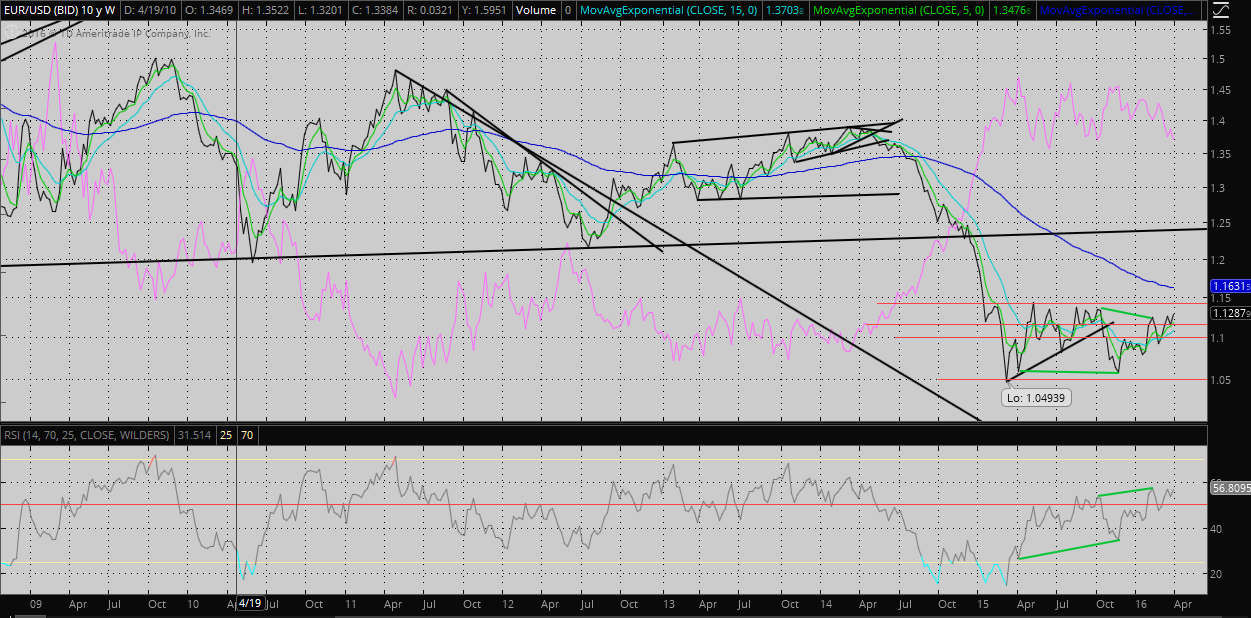
As I noted in my last post it was too early to call for a re-test of 52 week lows and indeed it was as while we did penetrate 50 on the RSI, it was only by a margin of a few points and thereafter we bounced at the target as explained in the short-term commentary. So you can see in this chart that we regained some support, but not much else is going on at the moment.
Long-Term has nothing see besides the fact that we regained support of the longer-term uptrend. The Euro ain’t dead yet baby! Speaking of currency deaths, wanted to clarify that Armstrong was actually talking about the beginning of a collapse in confidence in the EU. Not necessarily currency collapse (yet). So yeah.
OIL
Mid-Term
 Quick refresher from my last post:
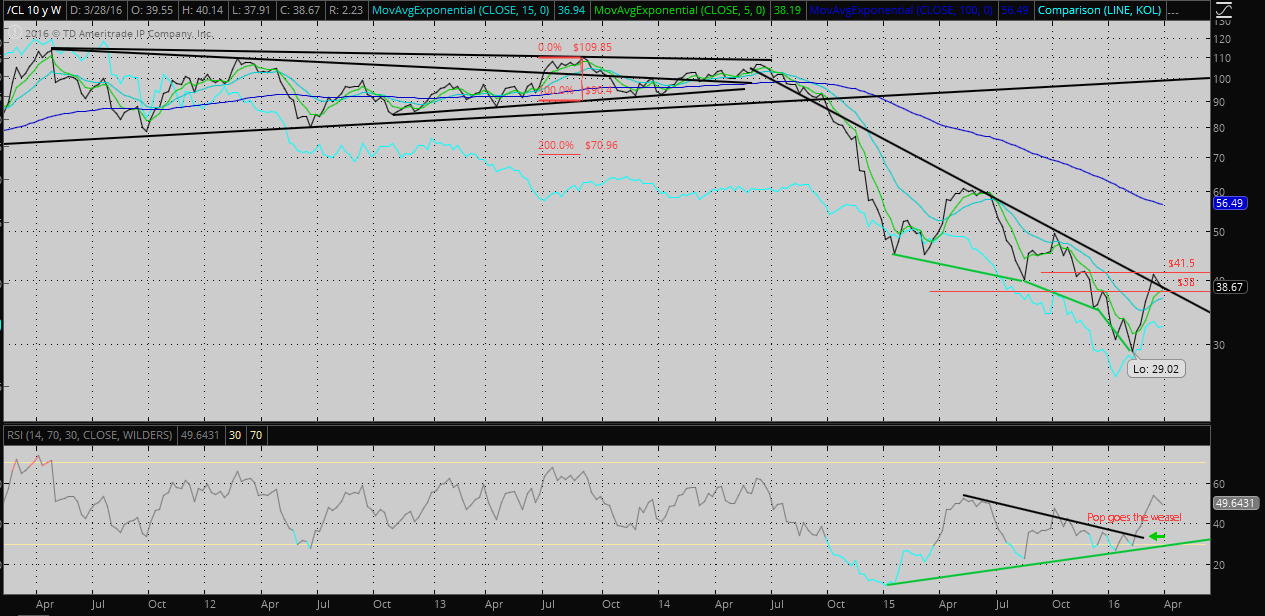
The RSI wedge I noted last time may be breaking to the upside…opens the possibility for a rally in oil…maybe touching $40
Well that happened basically. RSI exploded out of the wedge to the upside and of course so did the price. So now what? Yeah I would also like to know.
Oil is currently trading around $38 which is really an inflection point. As you can see this ties right in with the down-trend line. If Oil manages to hold on to $38 maybe Dennis Gartman will end up dying soon. On the other hand if we go back to say $36, we will probably be meeting up with $32 again real soon. The RSI really keeps this interesting though as it’s in such neutral territory right now (just like price). So in a few words, sorry I have zero idea where this is going to go right now. Long-term chart has nothing interesting.
And now for the Russell.
TF
Short-Term
 Ok reminder time:
If resistance at 1015 is broken we likely see 1050, perhaps stopping short at 1040.
So yeah resistance was broken. Then we didn’t really stop but just kept rocketing upwards to 1100. For this reason my commentary that was on Mid-Term is more interesting.
Note that recent up-move hasn’t been confirmed by RSI and volume is declining.
Mid-Term
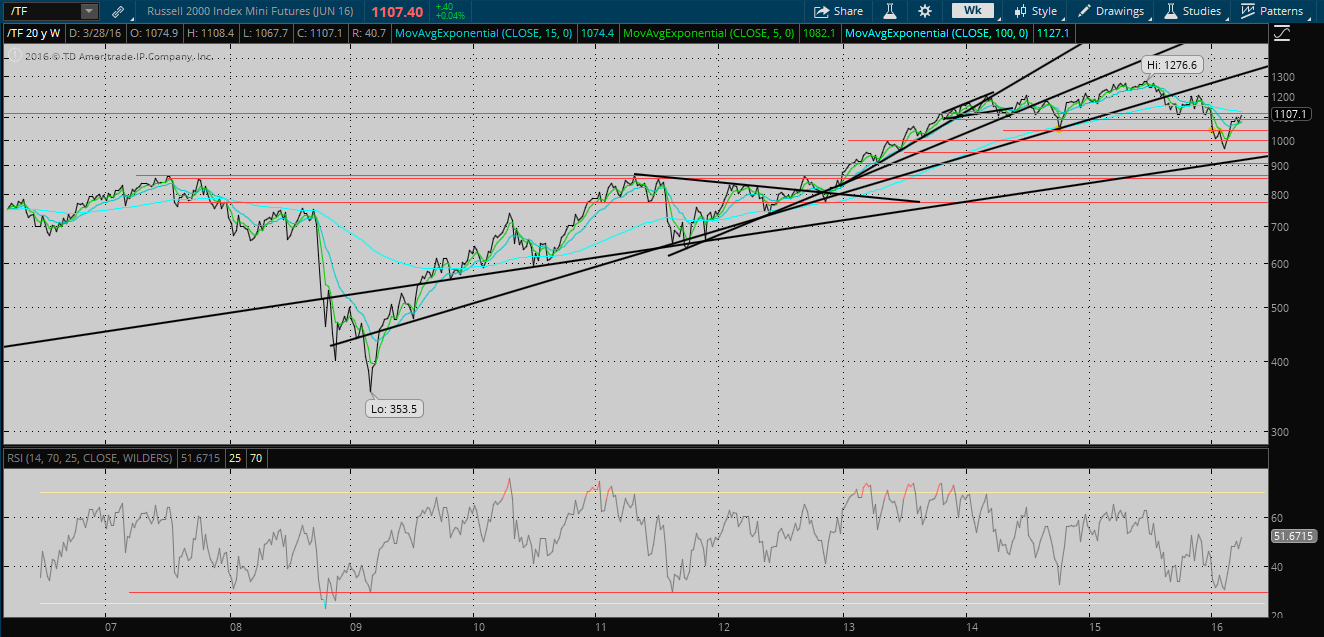
inclined to say that if resistance levels such as 1015 and 1050 are regained we could definitely see 1100 regained, easily
Which is exactly what we saw. RSI had a party and now we’re back to…August of 2015. Ehm. Well for the bulls better than nothing I guess. So now…there’s a target of 1115/16. If we get a few points above that (which might be tomorrow), I’ll try to figure out what’s next. Little bit concerned by the falling volumes though and we may just hover at this level for a bit. Find out soon enough.
Long-Term
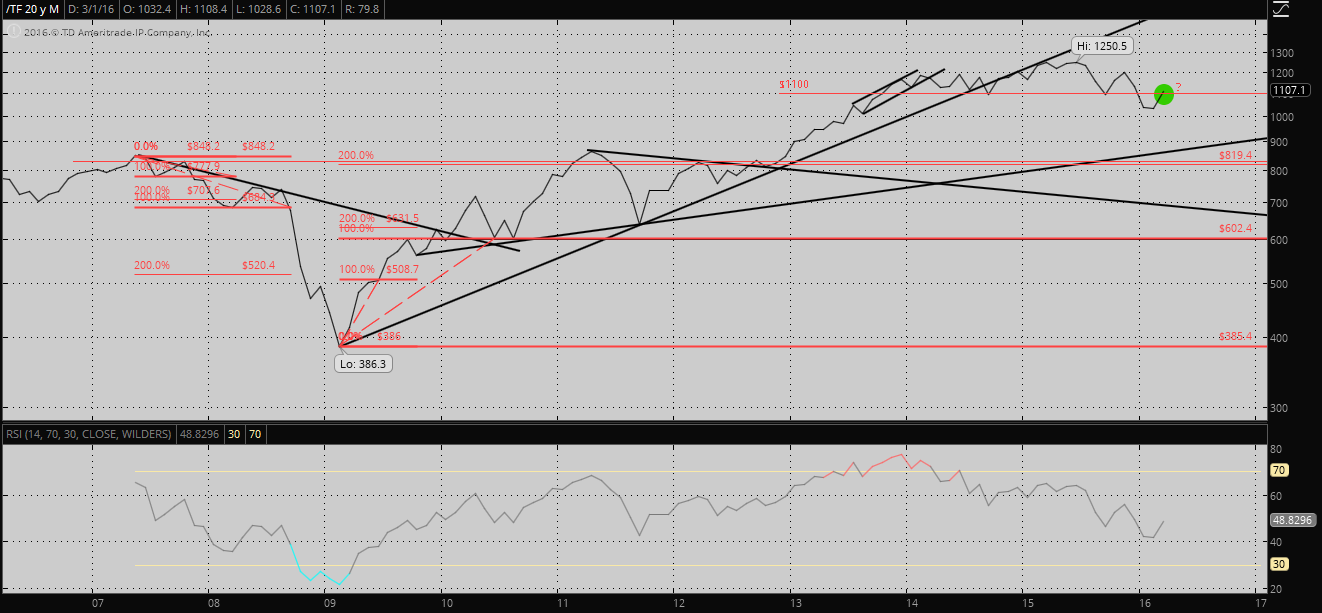 Just a reminder of where we stand now. Hovering around what has been a support area for a while now.
No SPX chart (sadface) but here’s my comments.
So we kinda got a large rally in the SPX as was expected. 120 points counts for something right? Not exactly like 2011/12 so far but maybe it still goes up from here, who knows. RSI did break upwards from its downtrend (and left its 5yr low far far below)hey that rhymes.
Also what is kind of a huge deal is that SPX regained its 80 wk EMA…puts the uptrend back in place for now basically.
So now some music. From…Kent once again. Love chans. Hate the music video. Honestly never liked Kent’s videos. But the music…
Btw, Juliet = Janet (Yellen)