Super late-night post. Because, why not? Can’t sleep quite yet, but not awake enough to do something which requires learning. So…let’s write and chart and all that jazz. Other time periods will be included in posts at later times…right now I just feel like posting a small overview of what I already have.
In short summary, everything is kind of wait and see at the moment…no significant technical breaks occurring anywhere meriting something like initiating a position (not that I would be doing that anyways).
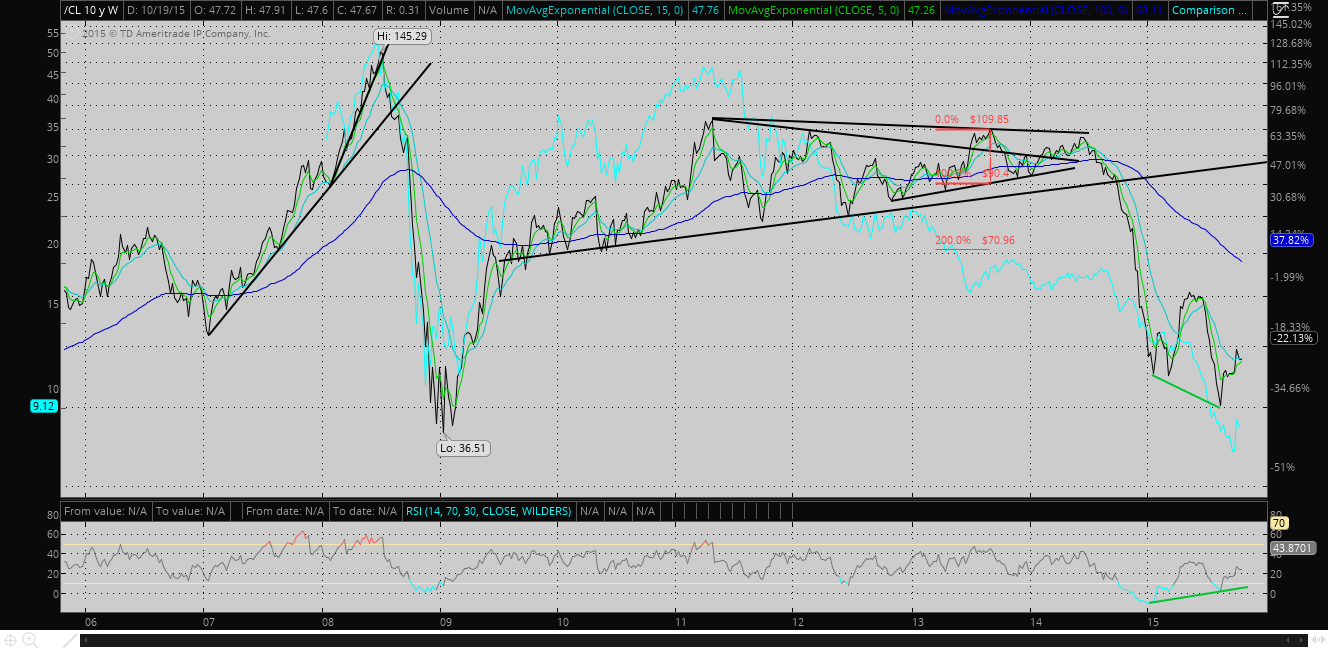
First up, Oil.
I shouldn’t have to comment on the current insane volatility that everyone knows about.
In the image you can see that there’s currently somewhat bullish divergence between the price movement and the RSI. RSI failed and still remains to get significantly above 50 (for now) though, which seems to suggest a bear market continuation. Oil does seem to be trying to not break through it’s 2008/9 lows, although we’ll see if that holds…the performance of this security at this point really does seem almost broke, but then again if we look at 2008, same exact thing happened. Oil is still a bit divergent from Coal’s performance, but much more caught up to it now than before (coal is the blue line). On this timeline there’s currently no significant trendlines it’s moving on right now.
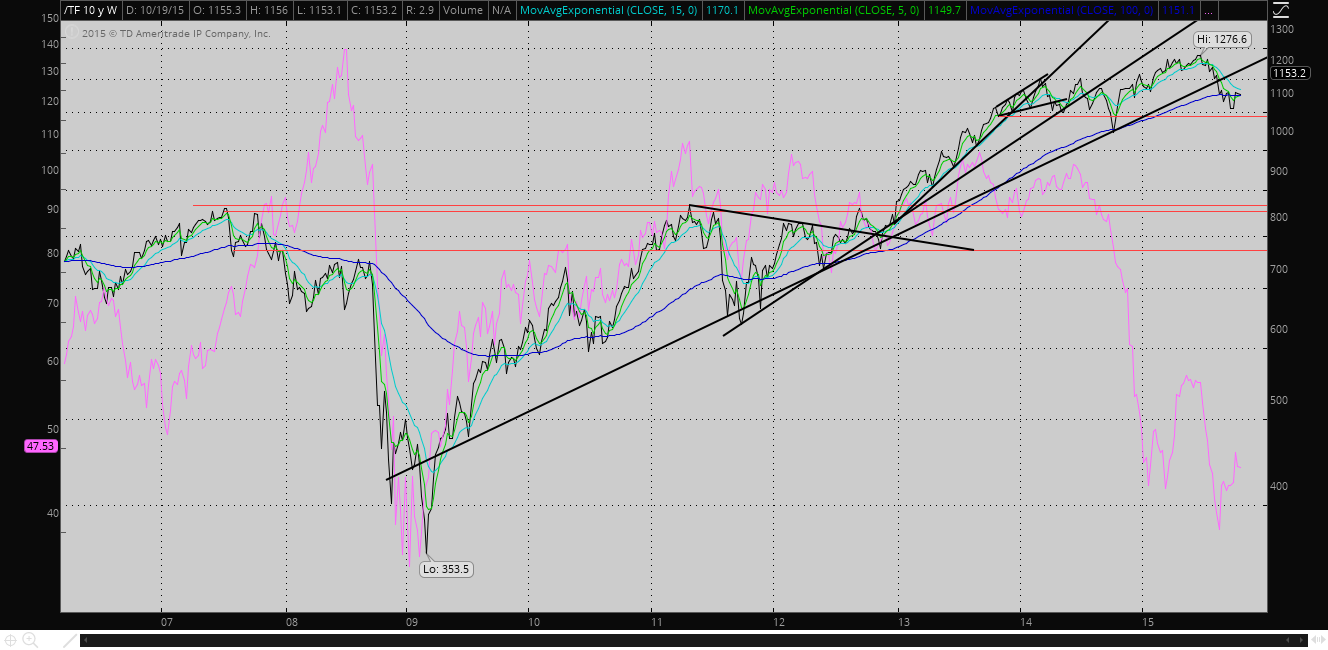
TF. I think that it has made an ATH for a little while and it will be correcting by a decent amount, to maybe 875 or so.
Repeated weakness, broke through any significant up trendlines it had made. Broken below the longer-term (blue) moving average, and fighting to get back over it but it looks like it’s failing to do so. Some support at the red line immediately below it, but after that there’s quite a big pocket of air with little support (besides psychological price levels) for rallies coming into play. Nothing interesting on RSI at the moment so it’s not included. If the Russell decides it’s time to play catch-up to oil…well…at least we could see it maybe coming
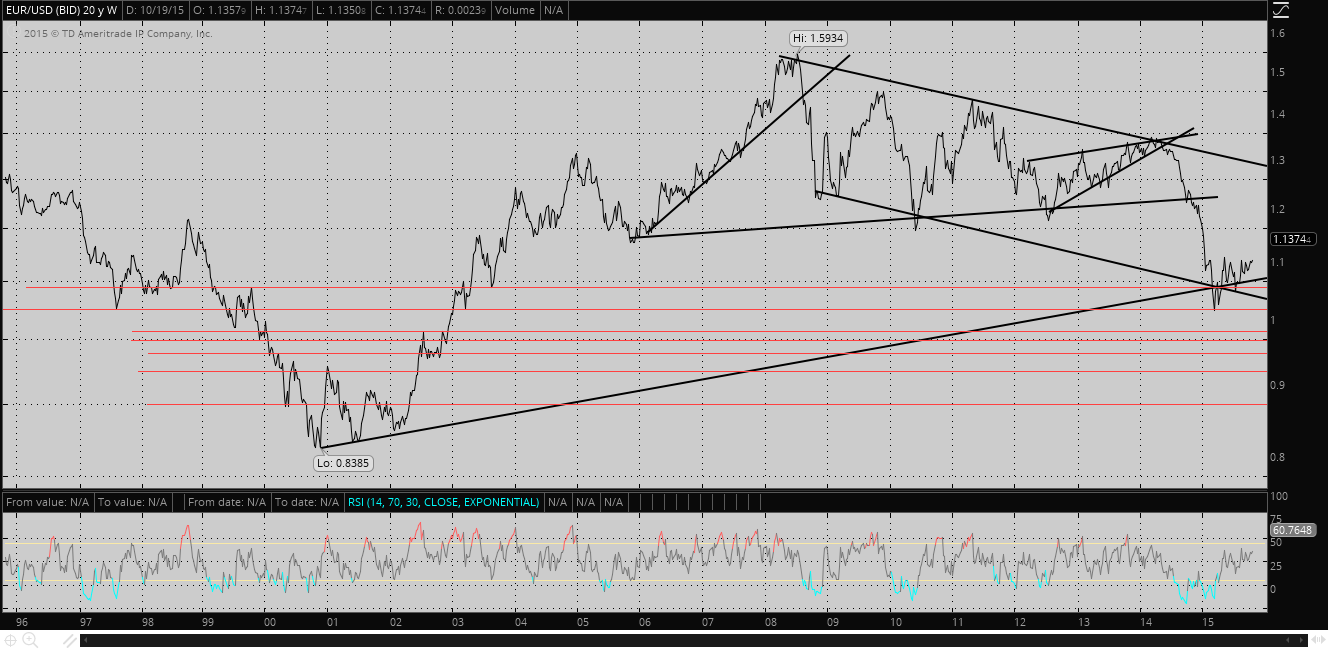
EUR/USD
Longer-term chart for this one because of the channel it’s been trading in.
For the past 7 years or so you can see the euro basically trading in a downwards channel. IMO this will continue to be the case for another year or so if prices rally a bit more from where they are now (to say 1.16). If they do rise then they’ll probably touch the channel top again. On the other hand this is still kind of an inflection point with the prices being so close to support levels and so if the EUR gets smashed below that, things change.
Nothing really on the RSI despite its inclusion.
Can see that there’s possibly a very long-term up trend supporting prices right now, in addition to the support it has from the red line and the channel bottom.
However the action right now is a bit weak without much follow-through and it’s still not a constructive price action since it hasn’t been able to break above the previous peak’s high.
Comments
Pingback: Are things going to break soon? | Eric's TA Alcove