Still don’t exactly understand how his comments are attributed to being such a huge catalyst. Only real interesting thing he said was
“So if those financial conditions were to remain in place by the time we get to the March meeting, we would have to take that into consideration in terms of that monetary policy decision,”
If the Fed goes back down on interest rates, it puts them in the same position as before the Fed raised interest rates. Which doesn’t exactly justify a move higher seeing that we were below 1.09 for November. Eh.
Anyways, D-day turned out to be dud-day. And the Fed’s decision to raise interest rates really did nothing at the time. Which actually makes all the sense in the world since everyone was expecting a big move one way or the other and then the market gave a tiny trading range…consensus (myself included), wrong again. Time for an update on charts though seeing that we have recently broken resistances with the recent move in the EUR. Oil is of course looking…very healthy (that was sarcasm). TF is bleeding. But EUR/USD first!
EUR/USD
Long-Term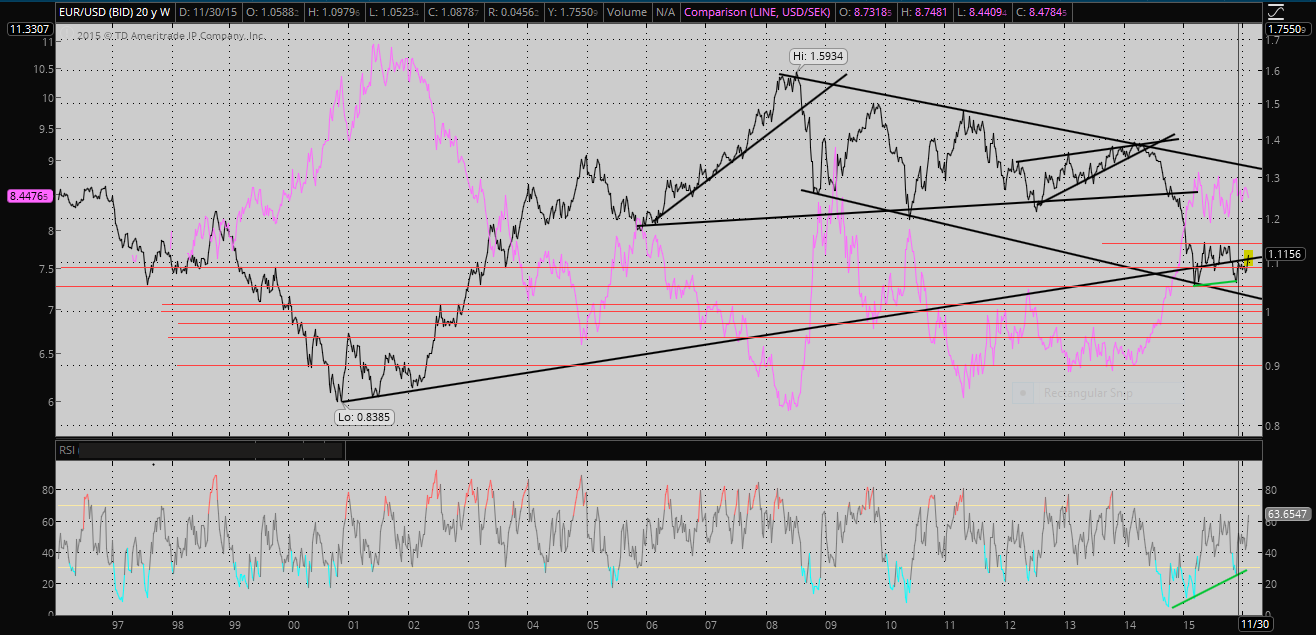 It appears that the EUR does not want to let go of an old trendline. Notice that there is some significant resistance above though at 1.14. RSI can rise further from here, but will be getting into overbought territory fairly soon if the move continues, which may coincide with the resistance at 1.14 setting up a potential reversal.
Mid-Term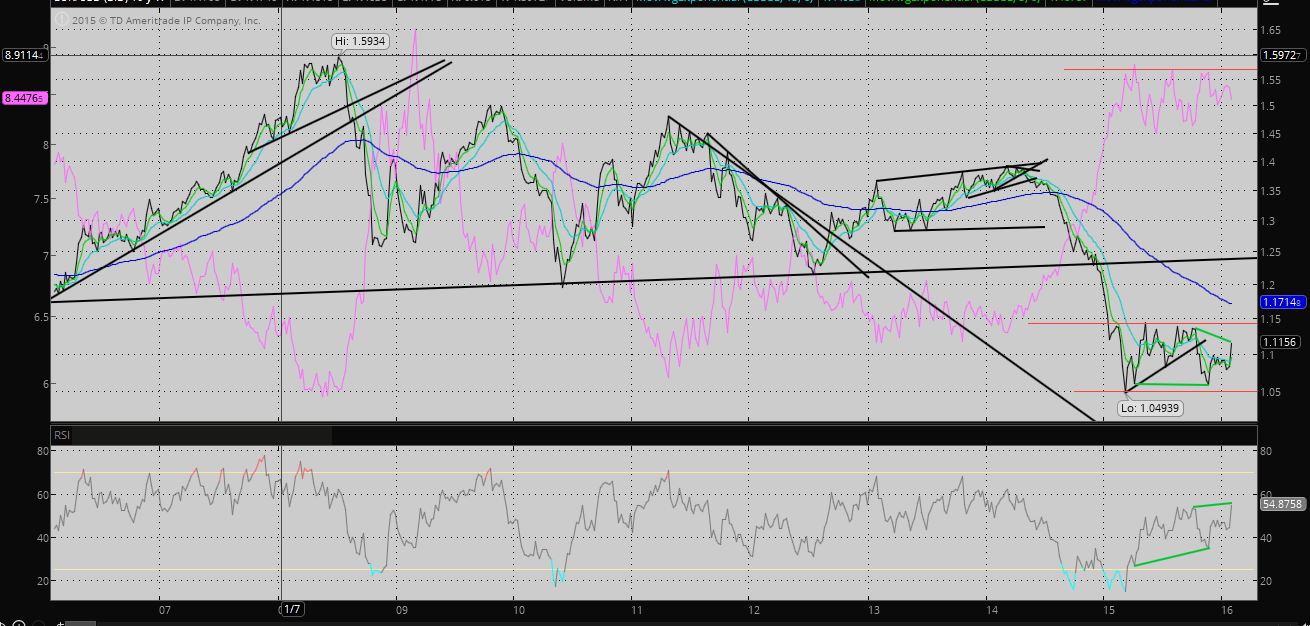 There is a slight divergence starting to build with the RSI which would be a calling for a more bullish move. Resistance stands above at 1.14/1.15.
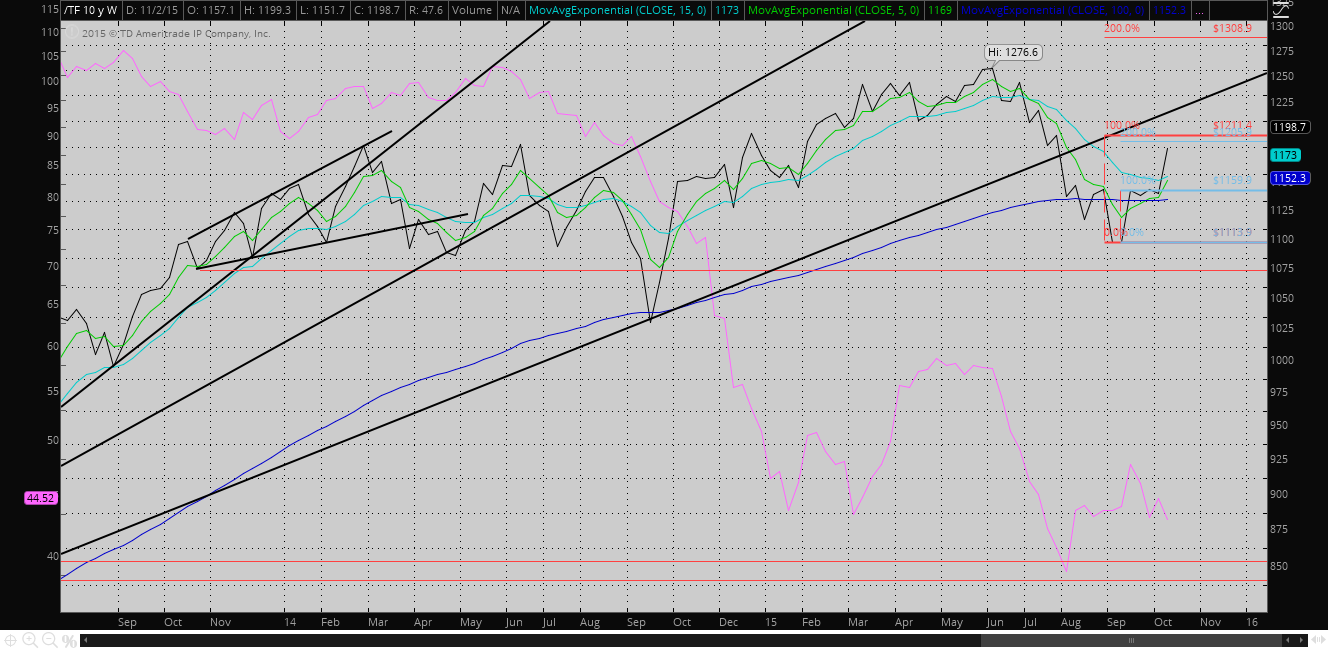
Short-Term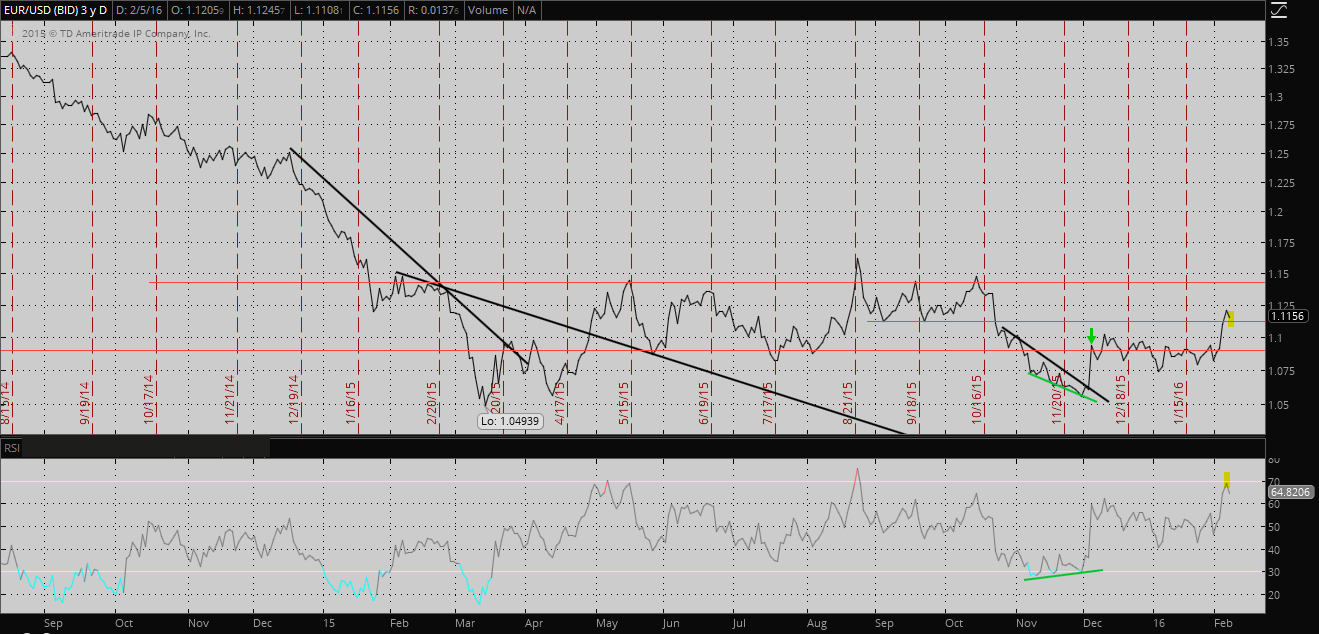 So, this chart likely clears up where we are headed for. Broke that resistance level at 1.11ish and now it looks like we’re in the process of a small re-test of the level as support. I didn’t notice it while making the chart but it looks like 1.125 may serve as a resistance level. Greater resistance is met at the 1.14 /1.15 level. RSI is getting close to being overbought so I’m thinking we may get a reversal at one of those resistance levels (think we probably just slightly fight 1.125 and then continue up towards the 1.14/1.15). Can’t say much beyond that at this time. So, that means it’s time for Oil.
Oil
Long-Term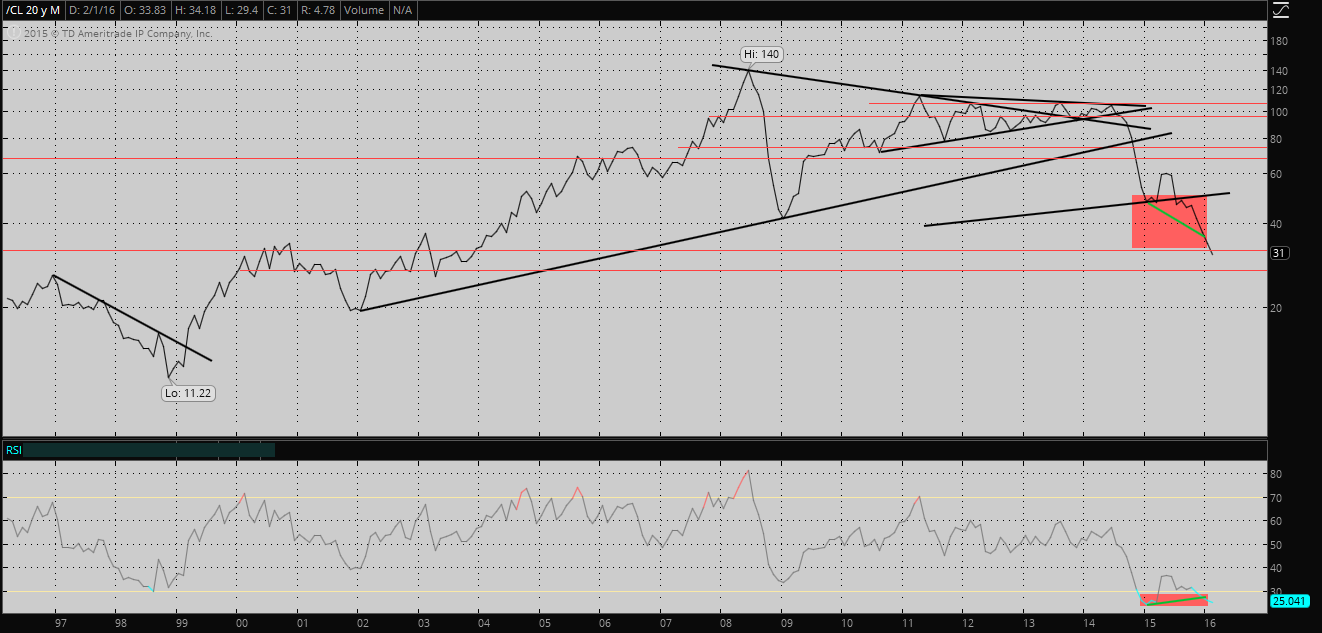 This chart is awful. Just awful. Whatever bullish divergence may have been building is gone (so it will be deleted next time this chart is posted). There is no real support for Oil at the level it currently is at. Not easy to get a clear picture on this. Potential support lies at $27.
Mid-Term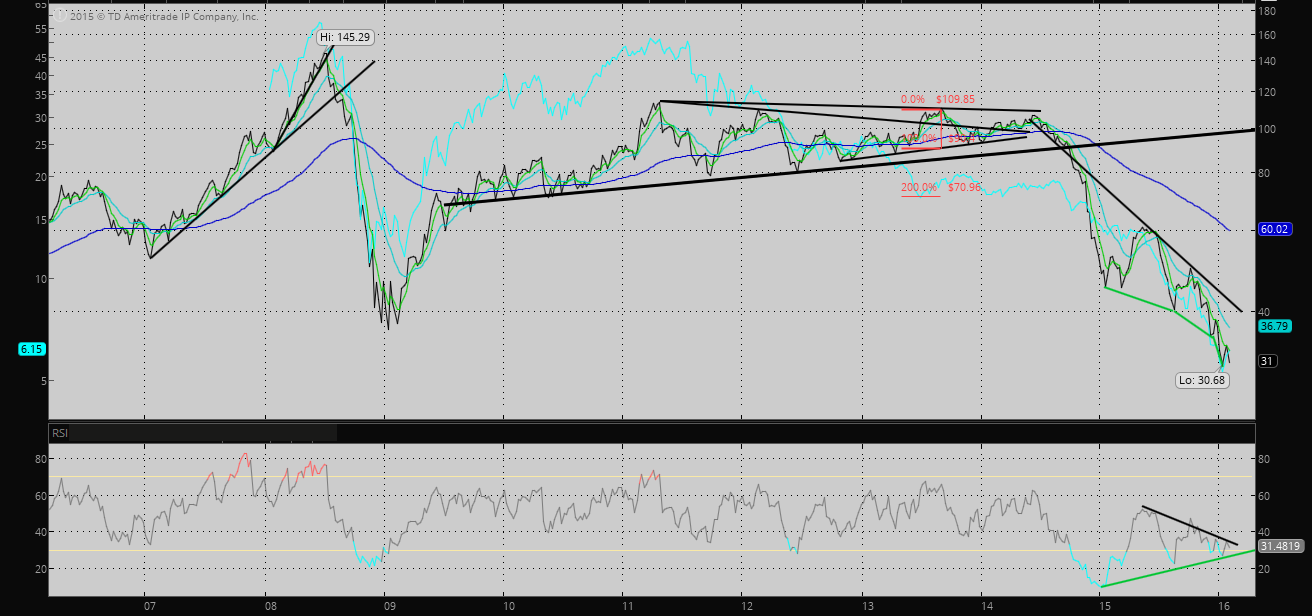 Support doesn’t really exist. However, bullish divergence continues to build in the RSI, BUT there is a clear wedge forming and it looks ready to break. Can’t say much else about this chart.
Oil is really too volatile in the Short-Term (or I’m too much of an amateur) unfortunately so I won’t be posting anything on that.
TF
I had said a couple months ago,
Right now what will determine if TF goes higher and retests the longer-term trendline (from the longer-term chart) is whether or not it breaks through the resistance it is currently encountering at 1200 (also a psychological level).
TF with the fine start to 2016 has clearly failed to do anything of the sort.
Long-Term
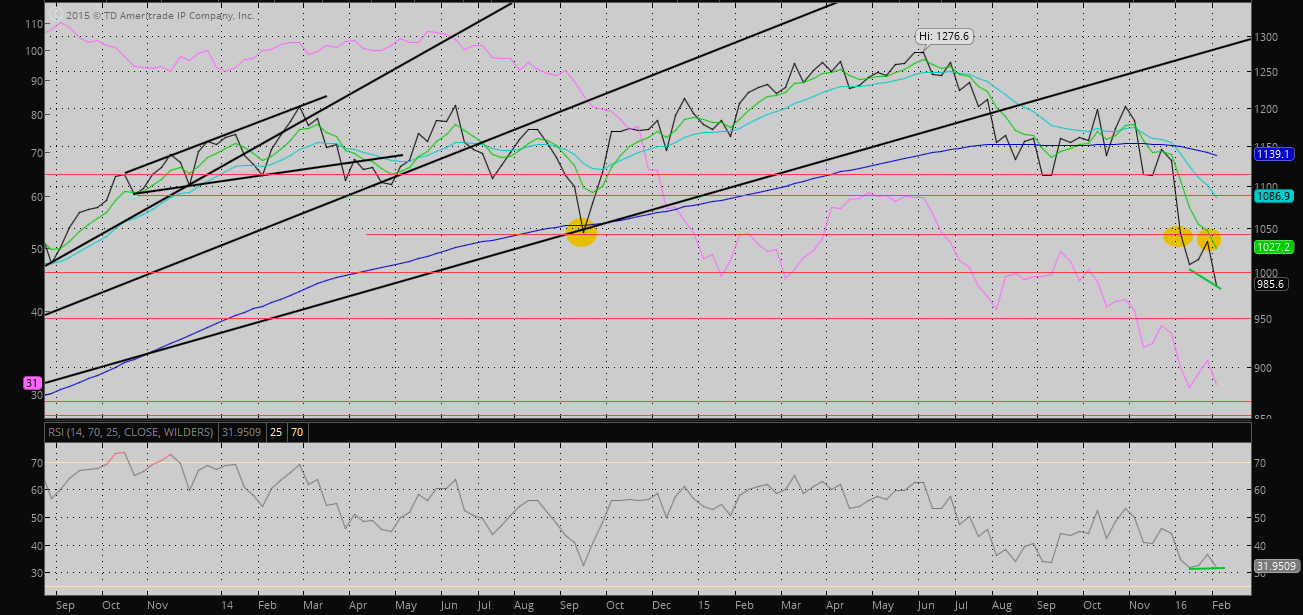 Not very pretty. There is no support currently. The support at that 1050ish level was broken and then acted as resistance (3rd oval). 1000 psychological mark was pushed through with ease. Which, given the RSI not confirming the latest move makes me wonder if we won’t get a re-test of that level before possibly moving back down towards 950.
Mid-Term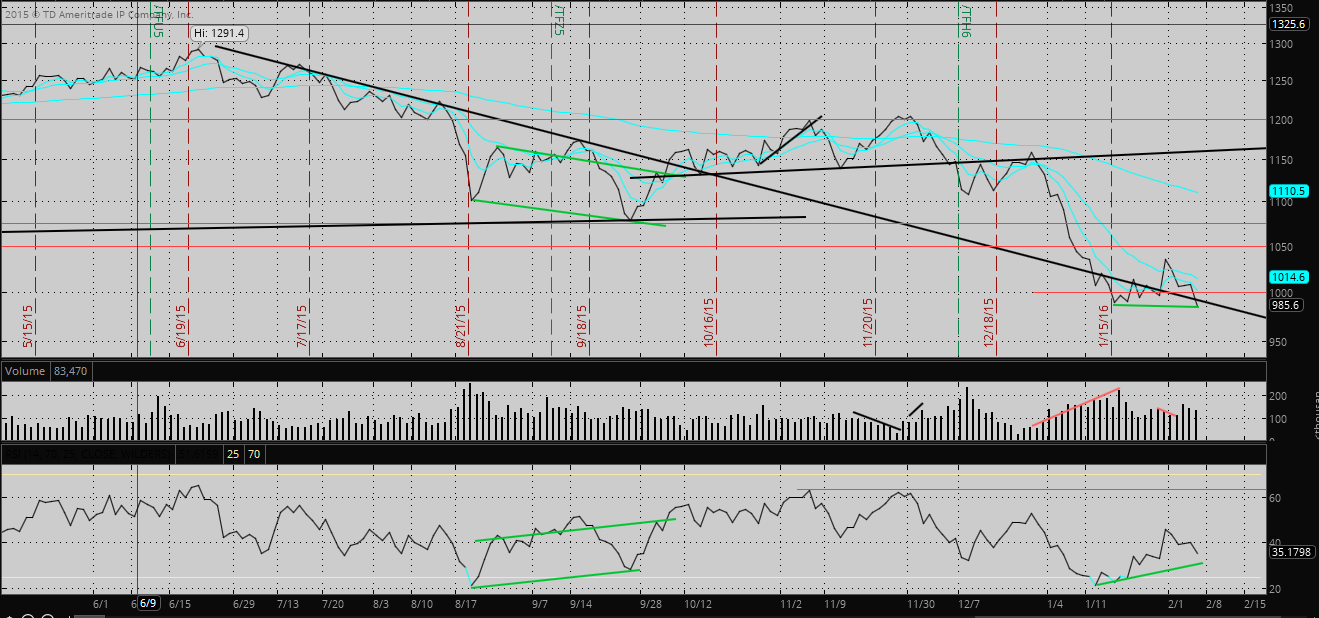 Notable bullish divergence with the RSI. Playing around with that longer trendline and 1000. Wait and see again really…
Comments
Pingback: EUR Bears – Back in the driver’s seat – Russell Rally? | Eric's TA Alcove