So, one of my classes in Berlin consists mainly of creating a supply chain simulation loosely based upon a real company and then meeting whatever goals we set (goals which require you to use the software; Anylogistix). I say loosely based, because we don’t have a lot of factors, such as warehouse/factory maximum capacity etc.
I chose to look at Glocken Bäckerei’s supply chain since they are transparent about their distribution network within Germany and this gives me a realistic base to start with. My goals were to add a few fictive new warehouses(i.e., customers) from REWE/Penny and then see how the current supply chain should be optimized.
One problem. In order to know Glocken Bäckerei’s demand, I need to know/estimate REWE and Penny’s demand for Glocken Bäckerei’s products as it was made clear that Glocken Bäckerei serves only REWE and Penny warehouses from the supply chain map.
So, dilemma. How do I estimate the demand of REWE and Penny’s warehouses? The professor simply said to make some ‘logical/reasonable assumptions’, about which cities each warehouse of REWE/Penny serves. Then take those cities’ populations and presume these are the demand figures for the respectively located warehouse of REWE/Penny.
Unfortunately, I find the phrase ‘logical assumption’ to be rather self-contradictory. I also wanted this simulation to be a bit more ‘real world’. I knew I could find the population data for each German city by looking at the country’s statistics office, but how could I calculate the demand for 31 different warehouses by just looking at the surrounding areas and making ‘logical assumptions’? Just manually looking at surrounding cities, then the population, and then putting these as demand for each warehouse would be rather time consuming, not to mention inaccurate as I would skip over smaller towns.
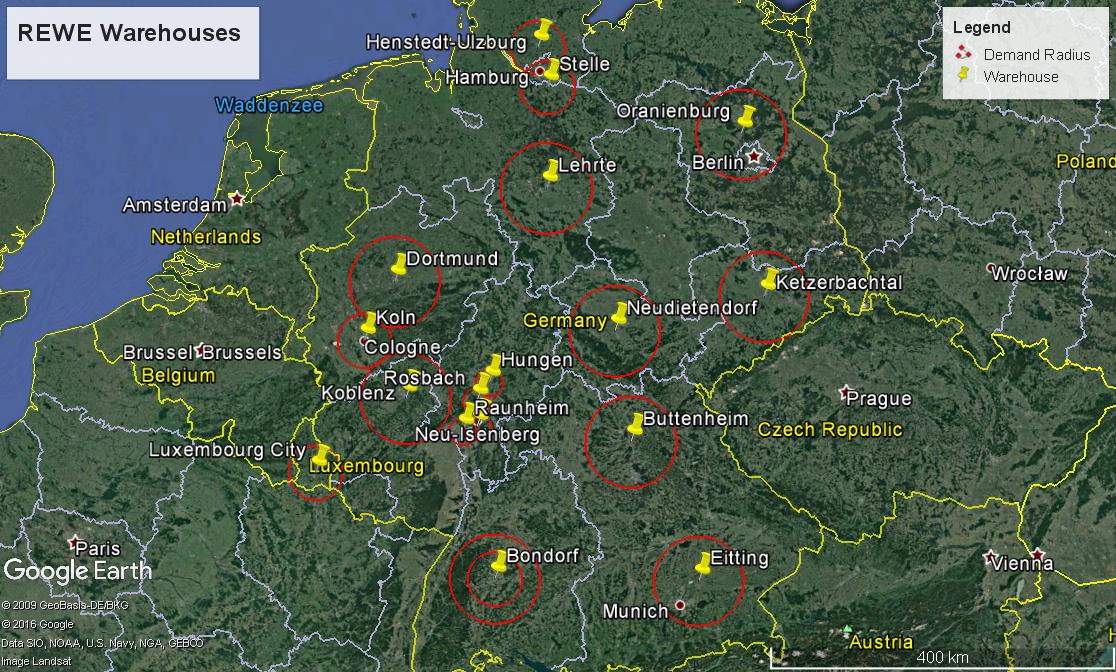
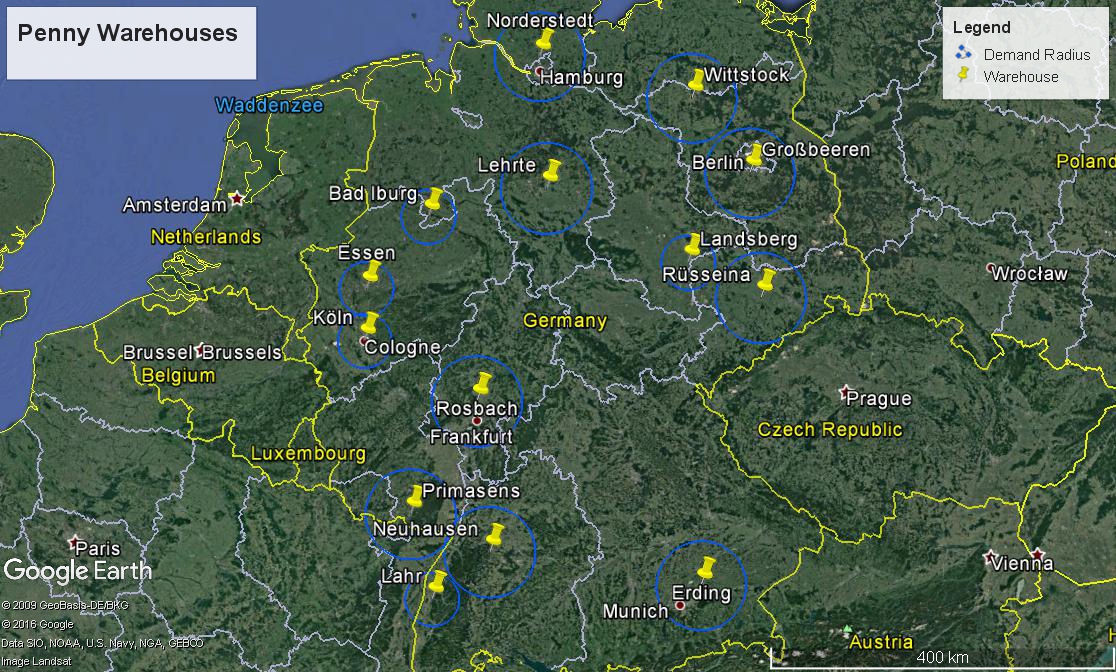
I then had an idea, but first needed to know a standard for the demand radius. My teacher suggested a radius of 30km in the west and more around 50km in the east, due to the sparser population. I took this as a guideline. So I plotted all the warehouses on Google earth. Then I looked at the surrounding area, to see if there were a lot of buildings or whiter areas to get an idea of the urban density.
I came up with the following.
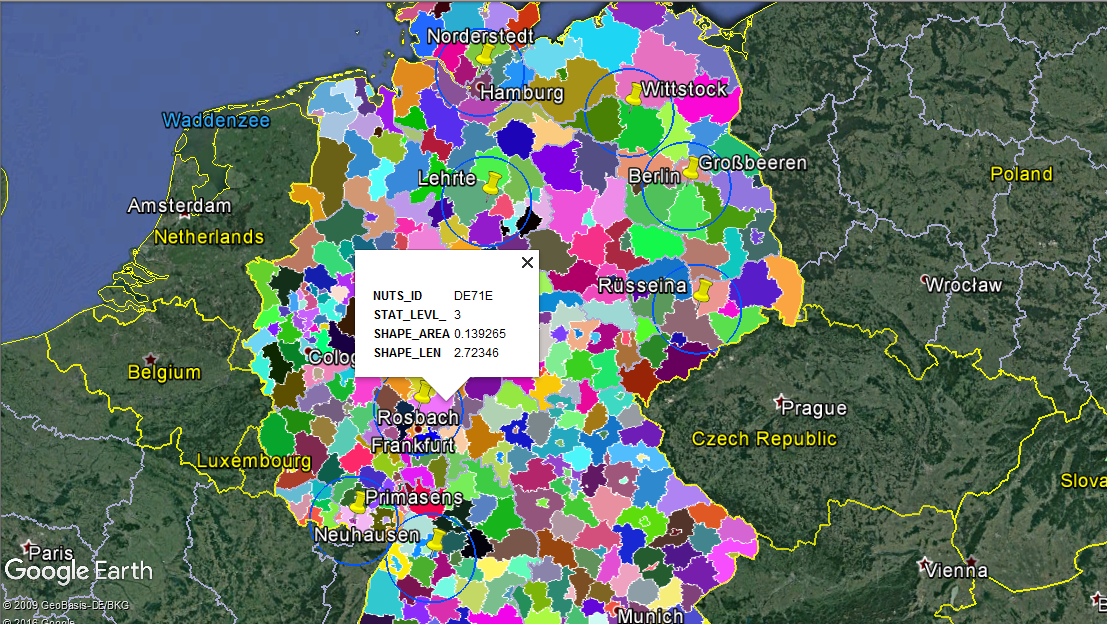
Still, the dilemma of being able to know the population within those circles remained. So now the idea. I remembered using NUTS region data in a previous project at my institution in Groningen. NUTS regions are standardized geographical regions determined by their respective country/province. They have varying levels of detail, NUTS 1, 2, and 3. As well as more detailed areas, LAUs 1 and 2 (Local Area Units).
I wondered if I could somehow plot these regions onto google earth. And I was able to thankfully find pre-created KML files (h/t @ http://www.gadm.org). So I took NUTS 3 data, and got this.
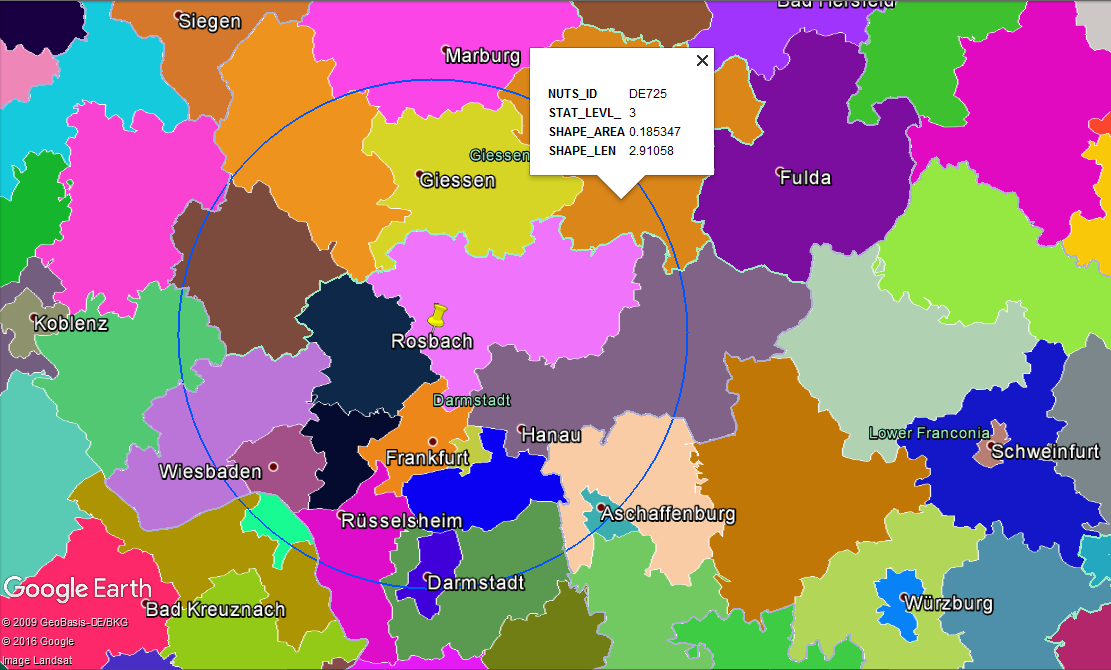
But now there’s yet another issue with accuracy, and that’s the split regions. How should I count population for regions that are not majorly inside the demand radius (like DE725)?
Take the LAU2 data.
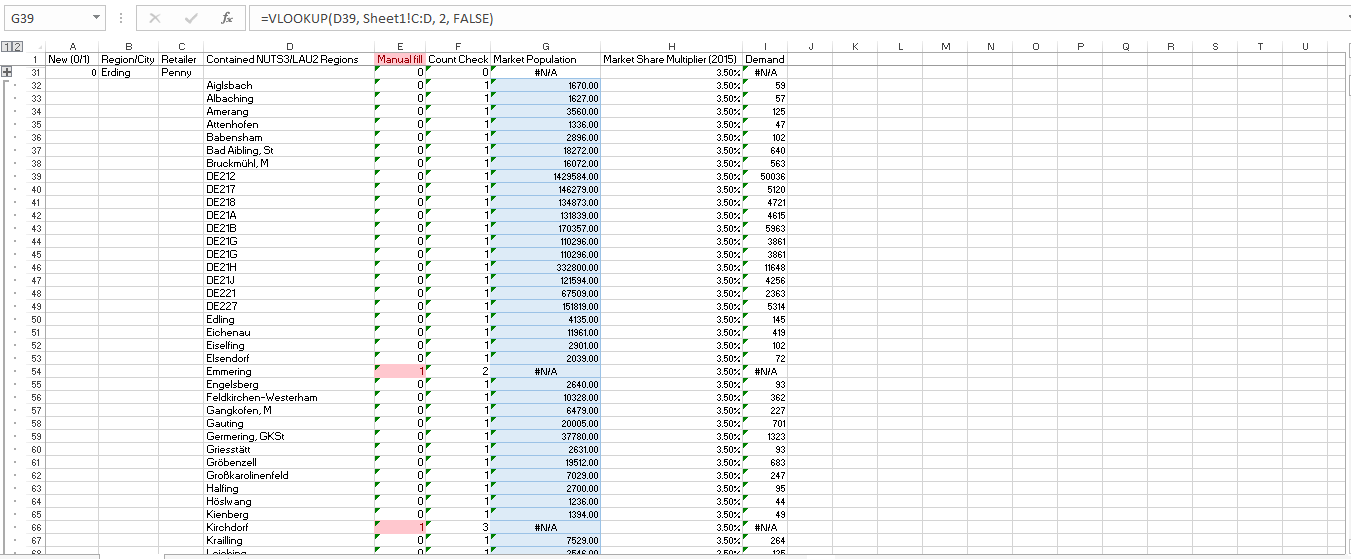
So I then created an excel spreadsheet and put in all warehouse locations. Then I manually make a list in the Excel spreadsheet of which NUTS3 regions fall mainly within the demand radius, and for those which are split, I go deeper to the LAU2 data points and take those which are mainly within the demand radius. It would have been nice to automate this part, and it probably could be done somehow, but I can only do so much without being taught. So manually entering into Excel it was.
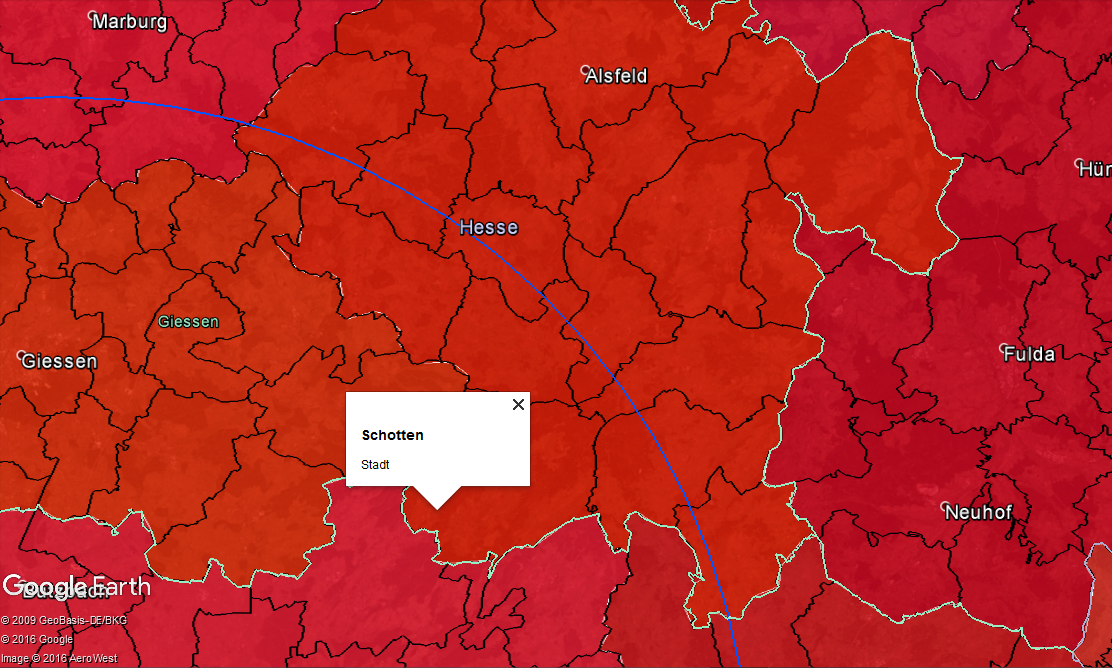
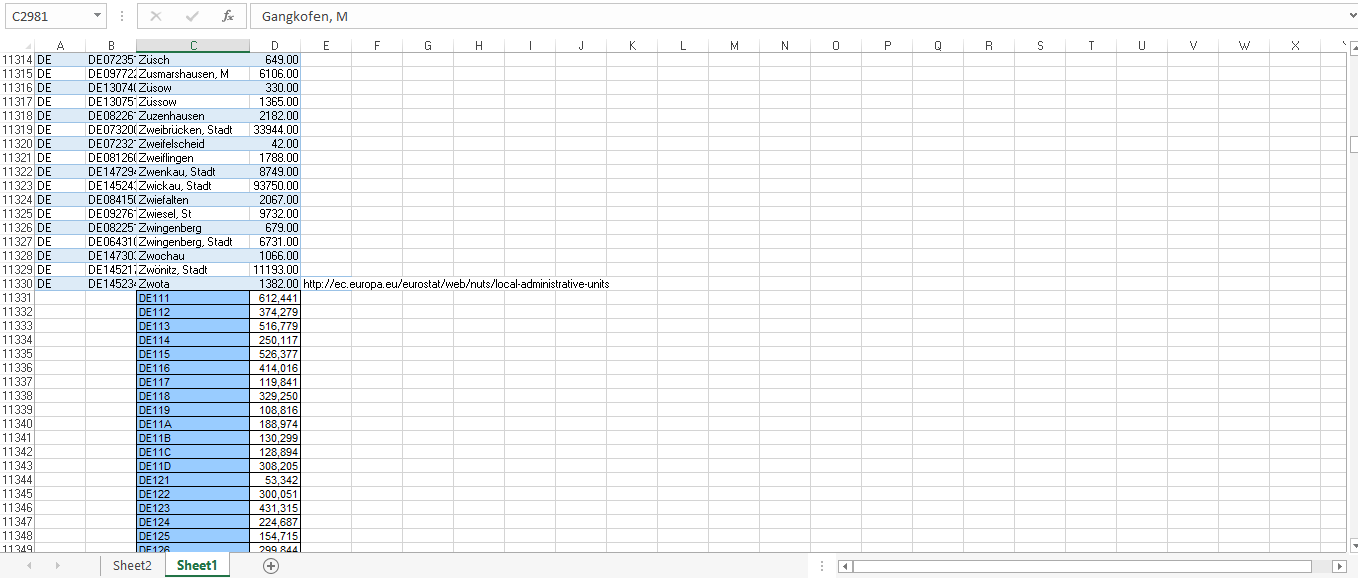
As you can see, the list of regions is still fairly large per warehouse, but I think it still beats looking up the cities within a demand radius and then their populations manually. I (mostly) automize the population lookup with VLookups. I need to get the region name exactly correct, but if I click on the region on google earth, it shows me what I should type in for that region name, i.e. Schotten, Stadt. Then it pulls the matching population value from the other sheet with more than 11000 data points (the population per NUTS3 / LAU2 region).
Because the LAU2 datas are collected by the Bundeslandes of Germany, sometimes the notation is a little different, being something like Schotten, St. Instead of Stadt. But that’s only in a few regions, like Bayern, and I get used to it once I know I’m in that region on the map. So no big deal.
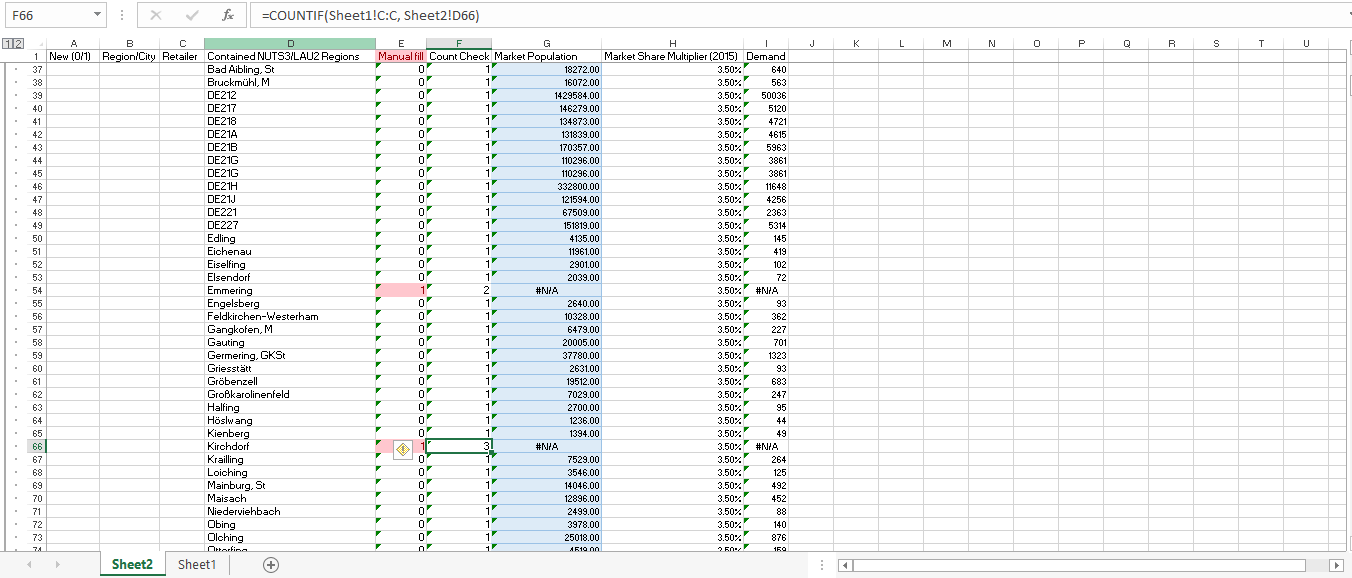
Occasionally there will be a city which has the same name as another city, and Vlookup isn’t able to distinguish which one to choose since the name value is the same. So I created a check for each city name, COUNTIF, and then how many times does the city name appear. If it’s more than one time or if it’s zero times, I need to manually look at that value. I used conditional formatting to make that a bit more obvious to me, and so you see an example of something that needs to be manually filled in Row 66, for Kirchdorf.
So, the final sum of all the regions contained in the demand radius is my initial demand. But I knew that obviously REWE or Penny is not going to be serving 100% of the population, so I looked for some market data on retail market share in Germany and found national data from Euromonitor. This gave me a multiplier for the initial demand, which gave me a final and (semi)realistic demand figure.
There are obviously still weaknesses with this demand figure, as I don’t have any idea what demand is per product of Glocken Bäckerei, and I imagine that market share varies on a regional basis. Unfortunately such data isn’t available to me, and it would probably also be getting too far into detail for the purpose of the university course.
This post was rather long.
Enjoy some music.
My work mainly focused on generation of KPIs or on business process improvement. Creation and…
https://public.tableau.com/profile/eric.a.stalee#!/vizhome/BLSUSEmploymentbyIndustry/Dashboard1 The Index of Employees by Industry shows an Industry's relative growth in employees since…
https://www.theregister.co.uk/2019/01/30/azure_sql_delete/
Had a sick day...now unable to sleep after sleeping too much. At least I don't…
http://www.reuters.com/article/us-eurozone-future-idUSKBN18Q23I One idea in the paper that did not involve any mutualization of debt was…